
Time to Completion for All Students Entering the Program
Time to Completion for all students entering the program |
| Outcome | Year in which Degrees were Conferred | |||||||||||||||||||||
| 2013-2014 | 2014-2015 | 2015-2016 | 2016-2017 | 2017-2018 | 2018-2019 | 2019-2020 | 2020-2021 | 2021-2022 | 2022-2023 | Total | ||||||||||||
| Total number of students with doctoral degree conferred on transcript | 5 | 3 | 2 | 4 | 2 | 5 | 5 | 5 | 5 | 5 | 41 | |||||||||||
| Mean number of years to complete the program | 7.2 | 4.3 | 5 | 4 | 7 | 6.4 | 4.2 | 4.9 | 4.75 | 4.6 | 5.2 | |||||||||||
| Median number of years to complete the program | 8 | 4 | 5 | 4 | 7 | 5.5 | 5 | 5 | 5 | 4 | 5 | |||||||||||
| Time to Degree Ranges | N | % | N | % | N | % | N | % | N | % | N | % | N | % | N | % | N | % | N | % | N | % |
| Students in less than 5 years | 1 | 20 | 2 | 50 | 0 | 0 | 4 | 100 | 0 | 0 | 0 | 0 | 2 | 40 | 2 | 40 | 1 | 20 | 3 | 60 | 11 | 27 |
| Students in 5 years | 1 | 20 | 1 | 25 | 2 | 100 | 0 | 0 | 1 | 50 | 3 | 60 | 3 | 60 | 2 | 40 | 4 | 80 | 1 | 20 | 13 | 32 |
| Students in 6 years | 0 | 0 | 0 | 0 | 0 | 0 | 0 | 0 | 0 | 0 | 1 | 20 | 0 | 0 | 1 | 20 | 0 | 0 | 1 | 20 | 3 | 7 |
| Students in 7 years | 0 | 0 | 0 | 0 | 0 | 0 | 0 | 0 | 0 | 0 | 0 | 0 | 0 | 0 | 0 | 0 | 0 | 0 | 0 | 0 | 0 | 0 |
| Students in more than 7 years | 3 | 60 | 0 | 0 | 0 | 0 | 0 | 0 | 1 | 50 | 1 | 20 | 0 | 0 | 0 | 0 | 0 | 0 | 0 | 0 | 5 | 12 |
The graduate catalog (Graduate Bulletin) contains policies for admission to graduate studies at Mississippi State University and for transfer of prior graduate-level course work. The Bulletin is available online at catalog.msstate.edu/graduate. Additional information is provided in the School Psychology Graduate Student Handbook, which contains additional information specific to the program. The Handbook is available here.
Program Costs for 2023‑2024 First Year Cohort
| Program Costs | |
| Description | 2023-2024 1st-year Cohort Cost |
| Tuition for full-time students (in-state) | $9,248 * |
| Tuition for full-time students (out-of-state) | $25, 444* |
| Tuition per credit hour for part-time students (if applicable enter amount; if not applicable enter "NA") | $514 (in-state) $1,413.84 (out-of-state) |
| University/institution fees or costs | $150.00 |
| Additional estimated fees or costs to students (e.g. books, travel, etc.) | $1,200 |
*Tuition for Full Time Students reflects fall and spring semesters, only. Summer tuition is calculated by semester hour. Note: All students who are provided a Graduate Assistantship receive a stipend and at least a 71% tuition remission and a waiver of out-of-state tuition. All students currently enrolled full-time (PhD and EdS) received an assistantship for 2020-2021 school year.
Internship Placement
| Internship Placement - Table 1 | ||||||||||||||||||||
| Outcome | Year Applied for Internship | |||||||||||||||||||
| 2013-2014 | 2014-2015 | 2015-2016 | 2016-2017 | 2017-2018 | 2018-2019 | 2019-2020 | 2020-2021 | 2021-2022 | 2022-2023 | |||||||||||
| N | % | N | % | N | % | N | % | N | % | N | % | N | % | N | % | N | % | N | % | |
| Students who obtained APA/CPA-accredited internships | 3 | 50 | 0 | 75 | 3 | 0 | 3 | 100 | 3 | 60 | 8 | 100 | 6 | 100 | 5 | 100 | 4 | 100 | 5 | 100 |
| Students who obtained APPIC member internships that were not APA/CPA-accredited (if applicable) | 0 | 25 | 0 | 0 | 0 | 0 | 0 | 0 | 0 | 0 | 0 | 0 | 0 | 0 | 0 | 0 | 0 | 0 | 0 | 0 |
| Students who obtained other membership organization internships (e.g. CAPIC) that were not APA/CPA-accredited (if applicable) | 0 | 0 | 0 | 0 | 0 | 0 | 0 | 0 | 0 | 0 | 0 | 0 | 0 | 0 | 0 | 0 | 0 | 0 | 0 | 0 |
| Students who obtained internships conforming to CDSPP guidelines that were not APA/CPA-accredited (if applicable) | 0 | 0 | 0 | 0 | 0 | 0 | 0 | 0 | 0 | 0 | 0 | 0 | 0 | 0 | 0 | 0 | 0 | 0 | 0 | 0 |
| Students who obtained other internships that were not APA/CPA-accredited (if applicable) | 1 | 25 | 0 | 25 | 0 | 0 | 2 | 0 | 1 | 40 | 0 | 0 | 0 | 0 | 0 | 0 | 0 | 0 | 0 | 0 |
| Students who obtained any internship | 4 | 100 | 0 | 100 | 3 | 0 | 5 | 100 | 4 | 0 | 8 | 100 | 6 | 100 | 5 | 100 | 4 | 100 | 5 | 100 |
| Students who sought or applied for internships including those who withdrew from the application process | 4 | - | 0 | - | 3 | - | 5 | - | 4 | - | 8 | - | 6 | - | 5 | - | 4 | - | 5 | - |
| Internship Placement - Table 2 | ||||||||||||||||||||
| Outcome | 2013-2014 | 2013-2015 | 2014-2015 | 2014-2016 | 2015-2016 | 2015-2017 | 2016-2017 | 2016-2018 | 2017-2018 | 2017-2019 | 2018-2019 | 2018-2020 | 2019-2020 | 2019-2021 | 2020-2021 | 2020-2022 | 2021-2022 | 2021-2023 | 2022-2023 | 2022-2024 |
| Students who sought or applied for internships including those who withdrew from the application process | 4 | - | 0 | - | 3 | - | 5 | - | 4 | - | 8 | - | 6 | - | 5 | - | 4 | - | 5 | - |
| Students who obtained paid internships | 4 | 100 | 0 | 0 | 3 | 100 | 5 | 100 | 4 | 100 | 8 | 100 | 6 | 100 | 5 | 100 | 4 | 100 | 5 | 100 |
| Students who obtained half-time internships* (if applicable) | 0 | 0 | 0 | 0 | 0 | 0 | 0 | 0 | 0 | 0 | 0 | 0 | 0 | 0 | 0 | 0 | 0 | 0 | 0 | 0 |
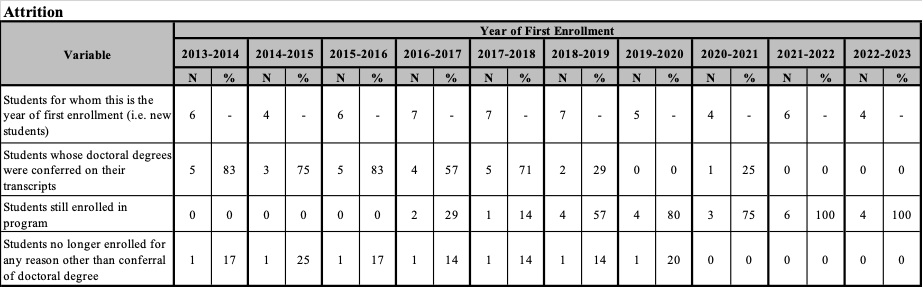
Attrition
Licensure
| 2013-2023 | |
|---|---|
| The total number of program graduates (doctoral degrees conferred on transcript) between 2 and 10 years ago | 25 |
| The number of these graduates (between 2 and 10 years ago) who became licensed psychologists in the past 10 years | 6 |
| Licensure percentage | 24% |
Program Disclosures
As articulated in Standard I.B.2, programs may have "admission and employment policies that directly relate to affiliation or purpose" that may be faith-based or secular in nature. However, such policies and practices must be disclosed to the public. Therefore, programs are asked to respond to the following question.
| Does the program or institution require students, trainees, and/or staff (faculty) to comply with specific policies or practices related to the institution’s affiliation or purpose? Such policies or practices may include, but are not limited to, admissions, hiring, retention policies, and/or requirements for completion that express mission and values? |
|---|
| No |